Mapseagarss provides a cloud based tool called “Seagrass Mapper” to classify seafloor information by utilizing remotely sensed data observed by optical sensors on board artificial satellites. This page explains overview of methodology used to construct the Seagrass Mapper. The methodology introduced here is from complied in Komatsu et al. (2020). If you want to publish your map obtained by the Seagrass Mapper or the Seagrass Trainer, please cite this paper for the methodology and acknowledge the Mapseagrass project.
Light is electromagnetic radiation, of which the true units are W m-2 ster-1 µm-1, consisting of wide range of wave lengths. Although visible and short infrared bands are generally available in satellite images, the visible bands can penetrate into the sea, deeper than ultra-violet and short infrared which are easily absorbed by the surface thin layer (Kawahara et al., 2000). Thus, visible bands are used for mapping habitats in coastal waters under the sea. In the ocean, a blue band reach the deepest and shallowest depths among blue, red and green bands, respectively (Figure 1).
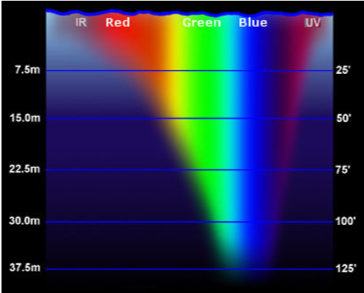
Figure 1. Patterns of vertical penetration of light between ultraviolet and infrared into the water (Source: http://www.seos-project.eu/modules/oceancolour/oceancolour-c01-p07.html)
Remote sensing by a satellite utilizes radiance of the visible bands from the sea beds received by an optical onboard sensor. The passage of visible band radiation from the sun to the satellite sensor is shown as a simplified schematic diagram in Figure 2 The visible band radiation from the sun passes two layers: atmosphere and water. In both layers, a part of light is absorbed and scattered by molecules and particulates from the sun to the sea bottom and from the sea bottom to the satellite. A part of light is also reflected by the sea surface. Radiances of visible bands recorded as digital numbers of pixels by the satellite sensor include bottom reflectance depending on substrate types (Figure 2). Thus, difference in reflectance of visible bands on the bottom surface under the shallow sea can be used to classify substrate types. In general, an optical sensor mounted on a satellite detects three bands of blue, green and red colors, while spectral distribution of each band depends on the optical sensor. Blue band is important to detect bottom types in deeper depth.
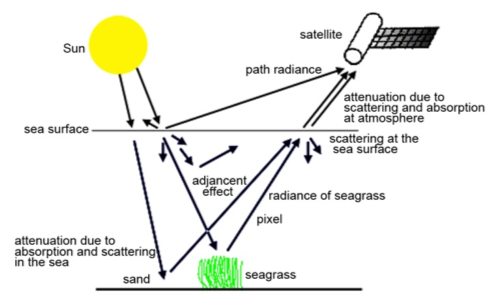
Figure 2. Schematic view of passage of electromagnetic radiation from the Sun to the satellite sensor through atmospheric layer, sea water column and sea bottom surface.
Reflectance is a ratio of leaving to incident radiation of a certain spectral window on surface of substrate. Figure 3 shows reflectance of sand and one species of Mediterranean seagrass, Posidonia oceanica L., from ultra-violet to infrared. We can find the differences in reflectance of visible bands between them. Since sand reflects from short wave length to long wave length, its color is white. On the other hand, the seagrass reflects green band around 550 nm. Then its color is green. If differences in reflectances exist corresponding to spectral windows of satellite optical sensor, it is possible to distinguish substrate types.
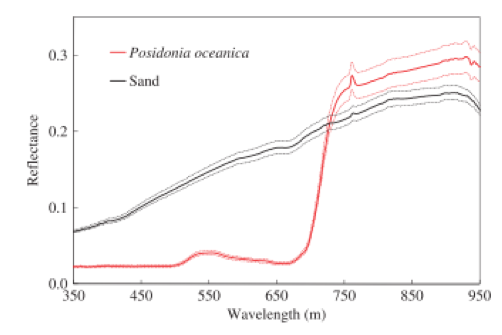
Figure 3. Reflectance level with reference to wavelength for each bottom feature (Mahares). Values (bold lines) are shown as the mean (±standard deviation represented by broken lines). For each bottom feature, n=5. (Source: Sagawa et al., 2010)
Although optical satellite sensors can capture radiance of seagrass, the radiance is affected by atmospheric layer and water column through the process. Thus, it is necessary to remove the effect of atmosphere and water column, before mapping seagrass habitats using images taken by satellite sensors (Gao et al., 2000; Lyzenga, 1978; Mumby and Edwards, 2000; Sagawa et al., 2010). The Northwest Pacific Action Plan, a part of Regional Sea Programme of United Nation Environment Programme, and Ocean Remote Sensing Project for Coastal Habitat Mapping of Sub-commission for Western Pacific, Intergovernmental Oceanographic Commission jointly standardized the atmosphere and water column correction using two simplest methods (Komatsu et al., in press): depth invariant index (DII) by Lyzenga (1981) and bottom reflectance index by Sagawa et al. (2010). Detail of the correction methods are described in the previous references. Although more sophisticated methods for the corrections are available, they need more complicated processing and other data obtained with a field survey synchronized with satellite that takes image of a target area.
After radiometric correction, habitats are extracted from satellite image data by analysis: one is pixel-based classification and the other is object-based one (Komatsu et al., in press). In coastal habitat mapping, pixel-based classification consisting of supervised or unsupervised classification is generally applied to multiband satellite data after radiometric correction mentioned above. Most classifications for seagrass mapping have been created using a pixel-based analysis of satellite multiband images. They used either a supervised classification or unsupervised classification. The pixel-based procedures analyze the spectral properties of every pixel within the region of interest. Ground truth data concerning bottom type distributions for each classification category are required. If ground truth data are not available, unsupervised classification can be used. Unsupervised classification groups pixels into some categories with similar bottom reflectance through a statistical standard such as ISODATA etc. After processing, some clusters are merged to one cluster when they represent a suitable class. Based on unsupervised classification, we can effectively conduct ground truth survey or field survey.